Eurostat HICP (EU-27) — Power BI
EU-themed Power BI model for the Harmonised Index of Consumer Prices (HICP). Includes a clean star schema, core DAX measures (Index, Monthly/Annual rates), and refreshable Eurostat API ingestion in Power Query (M). A lightweight Python app version is available too.


Click any image to enlarge.
Data Model
Tables
- FactHICP_Index
- FactHICP_Rates_YoY
- FactHICP_Rates_MoM
- FactHICP_Weights
- DimDate
- DimGeo
- DimCOICOP
Facts are filtered by DimDate, DimGeo, and DimCOICOP (single-direction). Separate facts keep rates lean and queryable without row-level recomputation.

Core DAX Measures
Below are the core measures used throughout the report. More measures are available in the repository.
Index =
AVERAGE ( FactHICP_Index[value] )

Annual inflation rate =
VAR Prev12 =
    CALCULATE (
        [Index],
        DATEADD ( DimDate[Date], -12, MONTH ),
        KEEPFILTERS ( VALUES ( DimGeo[geo] ) ),
        KEEPFILTERS ( VALUES ( DimCOICOP[coicop] ) )
    )
RETURN
    IF ( ISBLANK ( Prev12 ), BLANK (), DIVIDE ( [Index] - Prev12, Prev12 ) )

Monthly inflation rate =
VAR Curr = [Index]
VAR Prev = CALCULATE ( [Index], DATEADD ( DimDate[Date], -1, MONTH ) )
RETURN DIVIDE ( Curr - Prev, Prev )
Power Query (M) — Eurostat API
let
    // --- Parameters ---
    dataset     = "prc_hicp_midx",
    unitCode    = "I15",
    startMonth  = pStartMonth,
    endMonth    = pEndMonth,
    geosList    = pGeos,
    coicopsList = pCoicops,

    // --- Eurostat Statistics API URL ---
    Base   = "https://ec.europa.eu/eurostat/api/dissemination/statistics/1.0/data/",
    Parts  = List.Combine({
                {"lang=EN","freq=M","unit=" & unitCode,
                 "sinceTimePeriod=" & startMonth,"untilTimePeriod=" & endMonth},
                List.Transform(coicopsList, each "coicop=" & _),
                List.Transform(geosList,    each "geo=" & _)
            }),
    Url    = Base & dataset & "?" & Text.Combine(Parts, "&"),

    // --- Fetch + parse JSON-stat 2.0 ---
    Raw = Web.Contents(Url, [Timeout=#duration(0,0,90,0), Headers=[Accept="application/json"]]),
    J   = Json.Document(Raw),
    D   = if Record.HasFields(J, "dataset") then J[dataset] else J,

    // --- Dimensions (lower-cased) ---
    Ids  = List.Transform(D[id], each Text.Lower(Text.From(_))),
    DimR = Record.FromList(Record.FieldValues(D[dimension]),
                           List.Transform(Record.FieldNames(D[dimension]), Text.Lower)),

    GetCodes = (dimname as text) as list =>
        let d = Record.Field(DimR, dimname),
            cat = d[category],
            idx = try cat[index] otherwise null,
            codes =
                if idx <> null then
                    if Value.Is(cat[index], type list) then List.Transform(cat[index], each Text.From(_))
                    else if Value.Is(cat[index], type record)
                         then List.Transform(Table.Sort(Record.ToTable(cat[index]), {{"Value", Order.Ascending}})[Name], each Text.From(_))
                         else Record.FieldNames(cat[label])
                else if Record.HasFields(cat,"label") then Record.FieldNames(cat[label]) else {}
        in  codes,

    Codes = List.Transform(Ids, each GetCodes(_)),
    Sizes = List.Transform(Codes, each List.Count(_)),
    Mdim  = List.Count(Sizes),
    N     = if Mdim=0 then 0 else List.Product(Sizes),

    // --- Dense values vector (FIXED ReplaceRange call) ---
    ValRaw = D[value],
    Values =
        if Value.Is(ValRaw, type list) then ValRaw
        else if Value.Is(ValRaw, type record) then
            let names = Record.FieldNames(ValRaw),
                vals  = Record.FieldValues(ValRaw),
                pos   = List.Transform(names, each Number.FromText(_)),
                base  = List.Repeat({null}, N),
                zipped= List.Zip({pos, vals}),
                filled= List.Accumulate(zipped, base, (st, p) => List.ReplaceRange(st, p{0}, 1, {p{1}}))
            in  filled
        else List.Repeat({null}, N),

    // --- Build columns (last dimension varies fastest) ---
    Result =
        if N=0 then #table(Ids & {"value"}, {})
        else
            let
                idxs    = {0..N-1},
                radices = List.Transform({0..Mdim-1}, each if _=Mdim-1 then 1 else List.Product(List.Range(Sizes, _+1, Mdim-(_+1)))),
                DimCol  = (k as number) =>
                            let sizeK = Sizes{k}, radK = radices{k}, codeK = Codes{k}
                            in  List.Transform(idxs, (i)=> codeK{ Number.Mod(Number.IntegerDivide(i, radK), sizeK)}),
                Tbl     = Table.FromColumns(List.Transform({0..Mdim-1}, each DimCol(_)) & {Values}, Ids & {"value"})
            in  Tbl,

    // --- Clean & keep core fields ---
    Lower   = Table.TransformColumnNames(Result, Text.Lower),
    Norm    = if List.Contains(Table.ColumnNames(Lower), "time_period")
              then Table.RenameColumns(Lower, {{"time_period","time"}}) else Lower,
    WithUnit= if List.Contains(Table.ColumnNames(Norm), "unit")
              then Norm else Table.AddColumn(Norm, "unit", each unitCode, type text),
    Keep    = Table.SelectColumns(WithUnit, {"time","geo","coicop","unit","value"}, MissingField.Ignore),
    Typed   = Table.TransformColumnTypes(
                Keep,
                {{"time", type text},{"geo", type text},{"coicop", type text},{"unit", type text},{"value", type number}},
                "en-US"
              ),

    AddDate = Table.AddColumn(Typed, "Date", each Date.FromText([time] & "-01"), type date)
in
    AddDate
Parameters pStartMonth, pEndMonth, pGeos, pCoicops scope refresh.
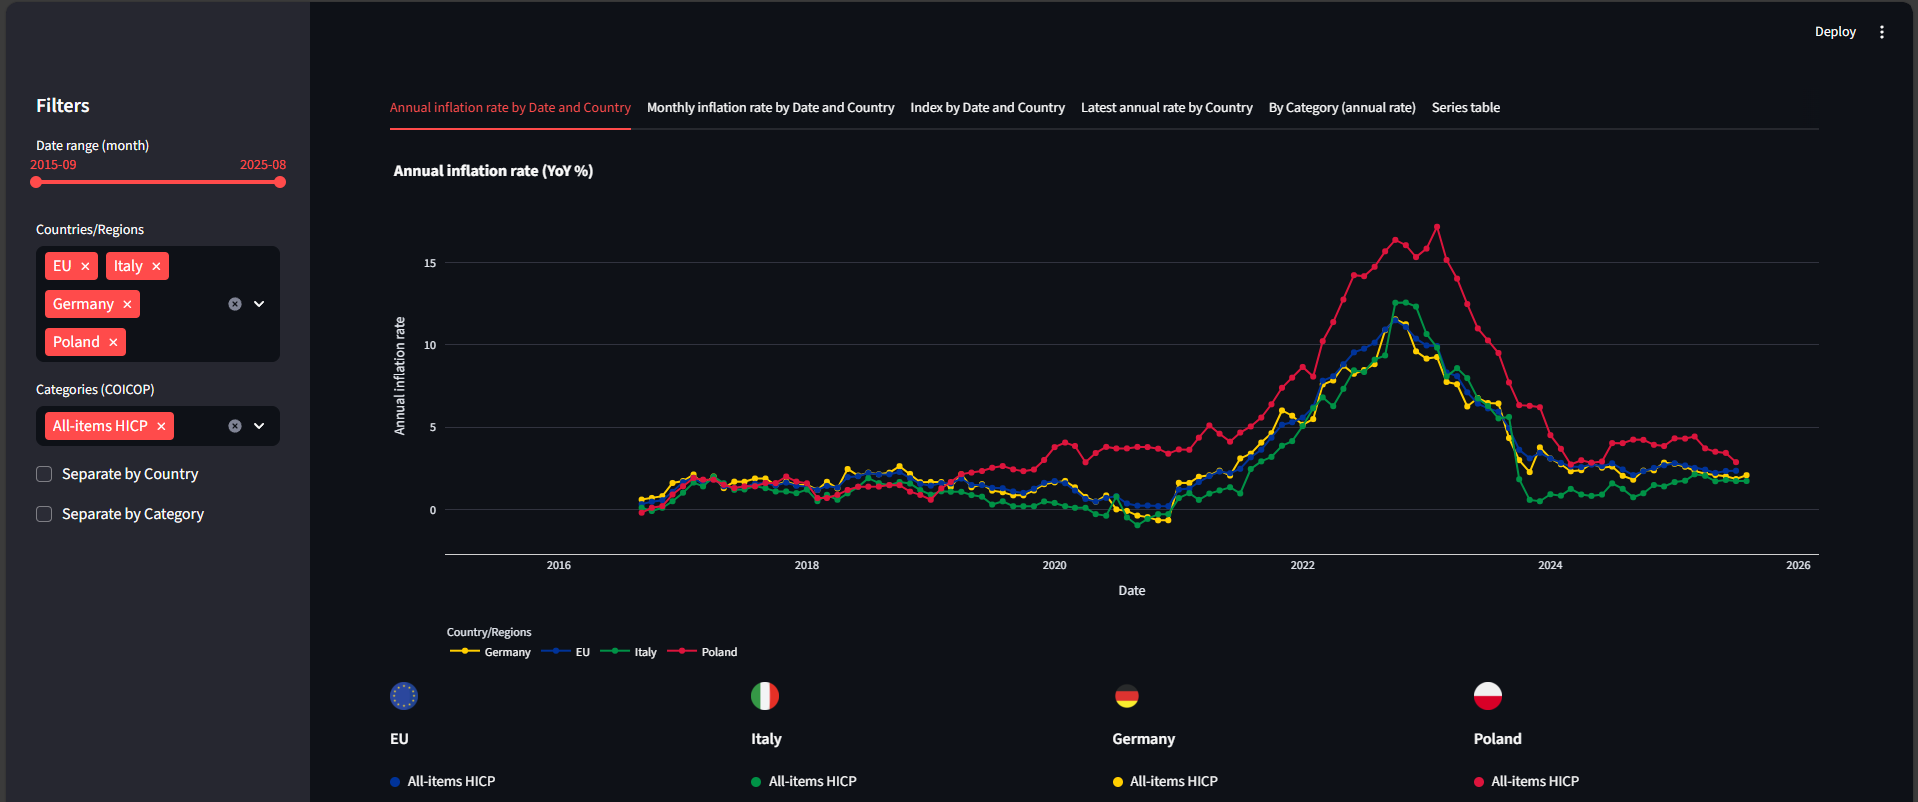
Python App (Interactive Explorer)
A lightweight, tabbed web app that lets you slice the Eurostat HICP data by time window, geographies, and COICOP categories, and then view index levels plus monthly/annual rates in charts and tables. Filters live in a compact panel; tabs switch between overview, trends, and comparisons. Data is pulled/reshaped in helpers and shared across tabs via a simple app state.
Data & Viz Highlights
Open app/ on GitHubfilters.py — user controls
Open file# Countries/regions and COICOP categories (trimmed example)
GEOS = ["EU", "DE", "IT", "PL"]
COICOPS = ["CP00", "CP011", "CP012"] # All-items + examples
# Default time window (Eurostat YYYY-MM)
DEFAULT_START = "2016-01"
DEFAULT_END = "2025-01"helpers.py — Eurostat fetch & shaping
Open fileimport requests, pandas as pd
BASE = "https://ec.europa.eu/eurostat/api/dissemination/statistics/1.0/data/prc_hicp_midx"
def build_url(start, end, geos, coicops, unit="I15"):
params = [f"lang=EN", f"freq=M", f"unit={unit}",
f"sinceTimePeriod={start}", f"untilTimePeriod={end}"]
params += [*(f"geo={g}" for g in geos), *(f"coicop={c}" for c in coicops)]
return f"{BASE}?" + "&".join(params)
def add_rates(df):
df = df.sort_values("Date")
g = df.groupby(["geo", "coicop"], sort=False)
df["Prev"] = g["value"].shift(1)
df["Prev12"] = g["value"].shift(12)
df["MoM"] = (df["value"] - df["Prev"]) / df["Prev"]
df["YoY"] = (df["value"] - df["Prev12"]) / df["Prev12"]
return dfThe rate formulas mirror DAX measures (MoM/YoY) so the Python app matches Power BI outputs.
tabs.py — Plotly visuals (example)
Open fileimport plotly.express as px
def annual_rate_by_country(df, coicop="CP00"):
d = df[df["coicop"] == coicop]
fig = px.line(
d, x="Date", y="YoY", color="geo",
title="Annual inflation rate (YoY %) — by date and country",
labels={"YoY": "YoY (%)"}, markers=False
)
fig.update_yaxes(tickformat=".1%")
fig.update_layout(template="plotly_dark", legend_title_text="")
return figmain.py — wiring
Open file# Pseudocode wiring (framework-agnostic)
from helpers import build_url, tidy_from_jsonstat, add_rates
from tabs import annual_rate_by_country
from filters import GEOS, COICOPS, DEFAULT_START, DEFAULT_END
import requests
url = build_url(DEFAULT_START, DEFAULT_END, GEOS, COICOPS)
js = requests.get(url, headers={"Accept":"application/json"}, timeout=60).json()
df = add_rates(tidy_from_jsonstat(js))
fig = annual_rate_by_country(df)
# render(fig) # Streamlit, Dash, or your chosen UI toolkit